Ecommerce Tracking: Why You’re Losing 40% of Data Have you ever opened three different dashboards and seen three completely different numbers for the same sales? Meta says 80. Shopify shows 52. Google Ads claims 40 of them. All three are wrong, and the problem is not on your end. In 2026, ecommerce tracking runs at […]
Setup & configuration best practices
Install server-side where possible (or proxy) to prevent blocking and ensure data quality. If using client code, load scripts async and after core page content to avoid performance hits.
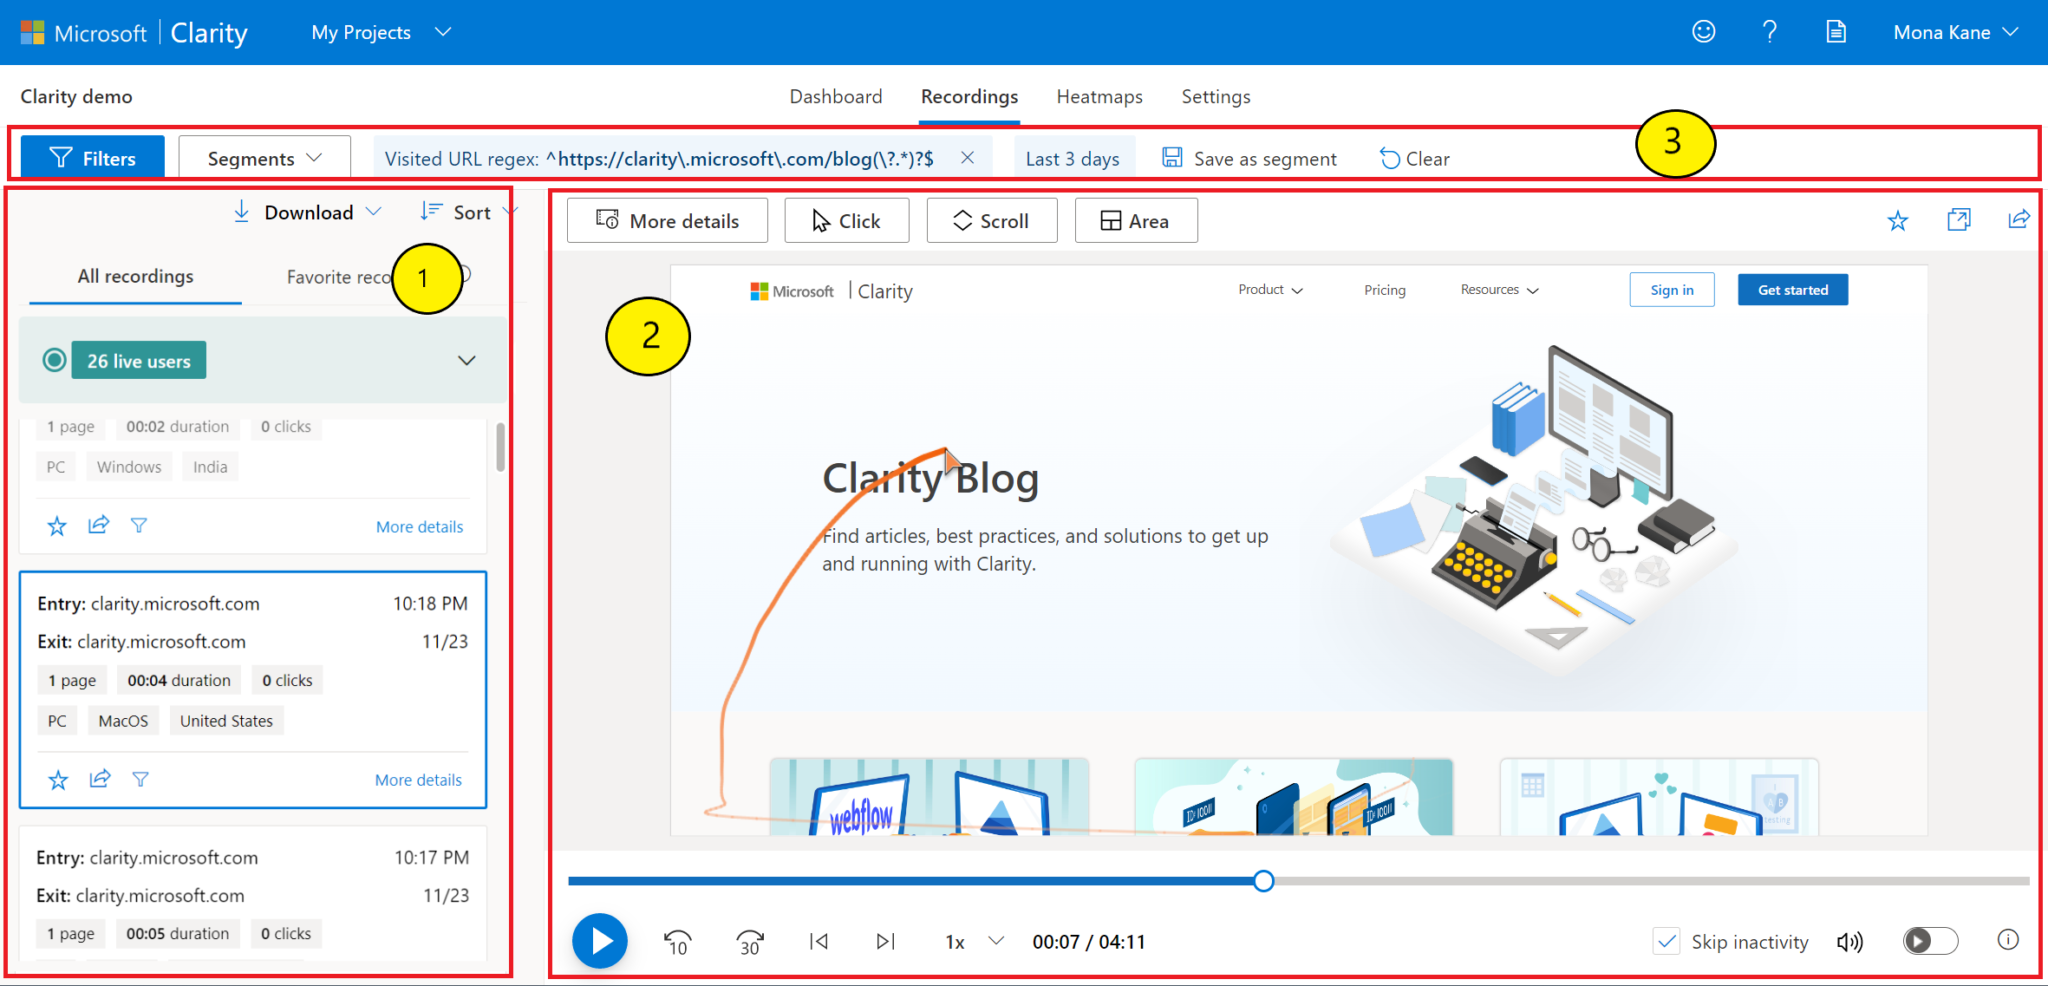
Limit sampling thoughtfully — recordings are expensive. Use targeted sampling: only record users in certain funnels, high-value sessions, or sessions with errors.
Integrate with back-end/CMS: pass order ID, product SKU, cart value, and user segment (logged in / guest) to recordings and heatmaps for segmentation.
Mask PII and secure data: configure automatic masking for inputs (names, card fields), and avoid recording entire payment pages unless using strict server-side obfuscation.
Device and browser segmentation: set separate heatmap/recording projects or filters for mobile vs desktop vs tablet — behaviors differ dramatically.
Define naming conventions for events and tags so your recordings and heatmaps are searchable and consistent across clients/projects.
Realistic examples and quick wins
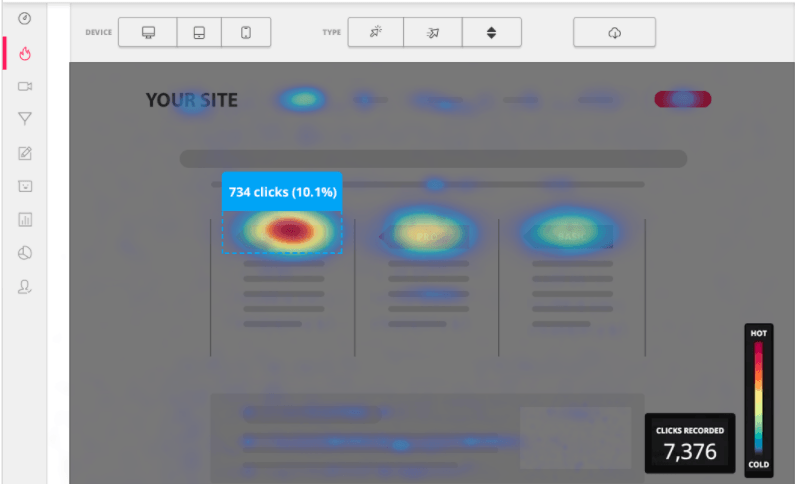
Promo banner ignored: Heatmap shows low clicks on a top promo banner. Action: A/B test moving promo into product tiles and showing promo info in product snippets. Result: better attribution and uplift in add-to-cart.
Checkout field dropouts: Form analytics show many dropouts on “postal code” field. Action: implement address autocomplete and country-specific validation. Result: decreased checkout abandonment.
Rage clicks on image carousel: Recordings reveal users repeatedly clicking an image carousel expecting it to enlarge. Action: add visible zoom icon and keyboard/tap support. Result: reduced frustration and increased time on page.
High scroll, low clicks on reviews: Users read reviews but don’t convert. Action: surface key review snippets near CTAs and add summary trust badges. Result: improved conversion rate on product pages.
Turning insights into prioritized experiments
Score the problem by impact × effort
Impact: estimated revenue at stake (traffic × CR lift).
Effort: dev/design time.
Create a simple hypothesis
“If we move shipping info above the fold on mobile, then mobile checkout CR will increase by X%.”
Design a validated A/B test
Use analytics as the source of truth for baseline and expected effect.
Run targeted tests
Test only on relevant segments (e.g., returning visitors, mid-ticket items).
Measure beyond last-click
Look at micro-conversions (add-to-cart, checkout start) not only purchases.
Using qualitative feedback together with behavior data
Triangulate: recordings tell you what happened, surveys tell you why, analytics tells you how often. Use all three.
Customer interviews for high-value cases: when recordings and surveys hint at complex friction, interview affected users (high LTV customers first).
Use feedback to shape micro-copy: a 3-word line in product description can fix a misunderstood feature — validate via A/B.
Integrating into agency workflows
Weekly UX triage: short sessions to review recordings flagged by rage clicks and analytics anomalies.
One-pager recommendations: each insight → one recommended change → prioritized A/B test. Keep stakeholders aligned with impact estimates.
Handover artifacts: timestamped recordings, annotated heatmaps, and sample user quotes for designers/devs.
Maintain a insights backlog: not all insights turn into tests

Dominate Your Neighborhood: Local SEO Services | Rocket Agency
Dominate Your Neighborhood: Local SEO Services | Rocket Agency At Rocket Agency, we don’t believe in fireworks for the sake of the show. We believe in numbers. We believe that every Euro you spend on marketing should return with friends. You already know us for plugging funnel leaks in your ads and tightening your email […]
How to Use Email Marketing to Turn First-Time Buyers Into Lifelong Customers
How to Use Email Marketing to Turn First-Time Buyers Into Lifelong Customers Introduction Every successful eCommerce business eventually learns a vital truth: the real profits come after the first sale. Acquiring new shoppers is important, but if those first-time buyers never return, you’re left constantly chasing the next sale – often at high cost. Turning […]